Introduction
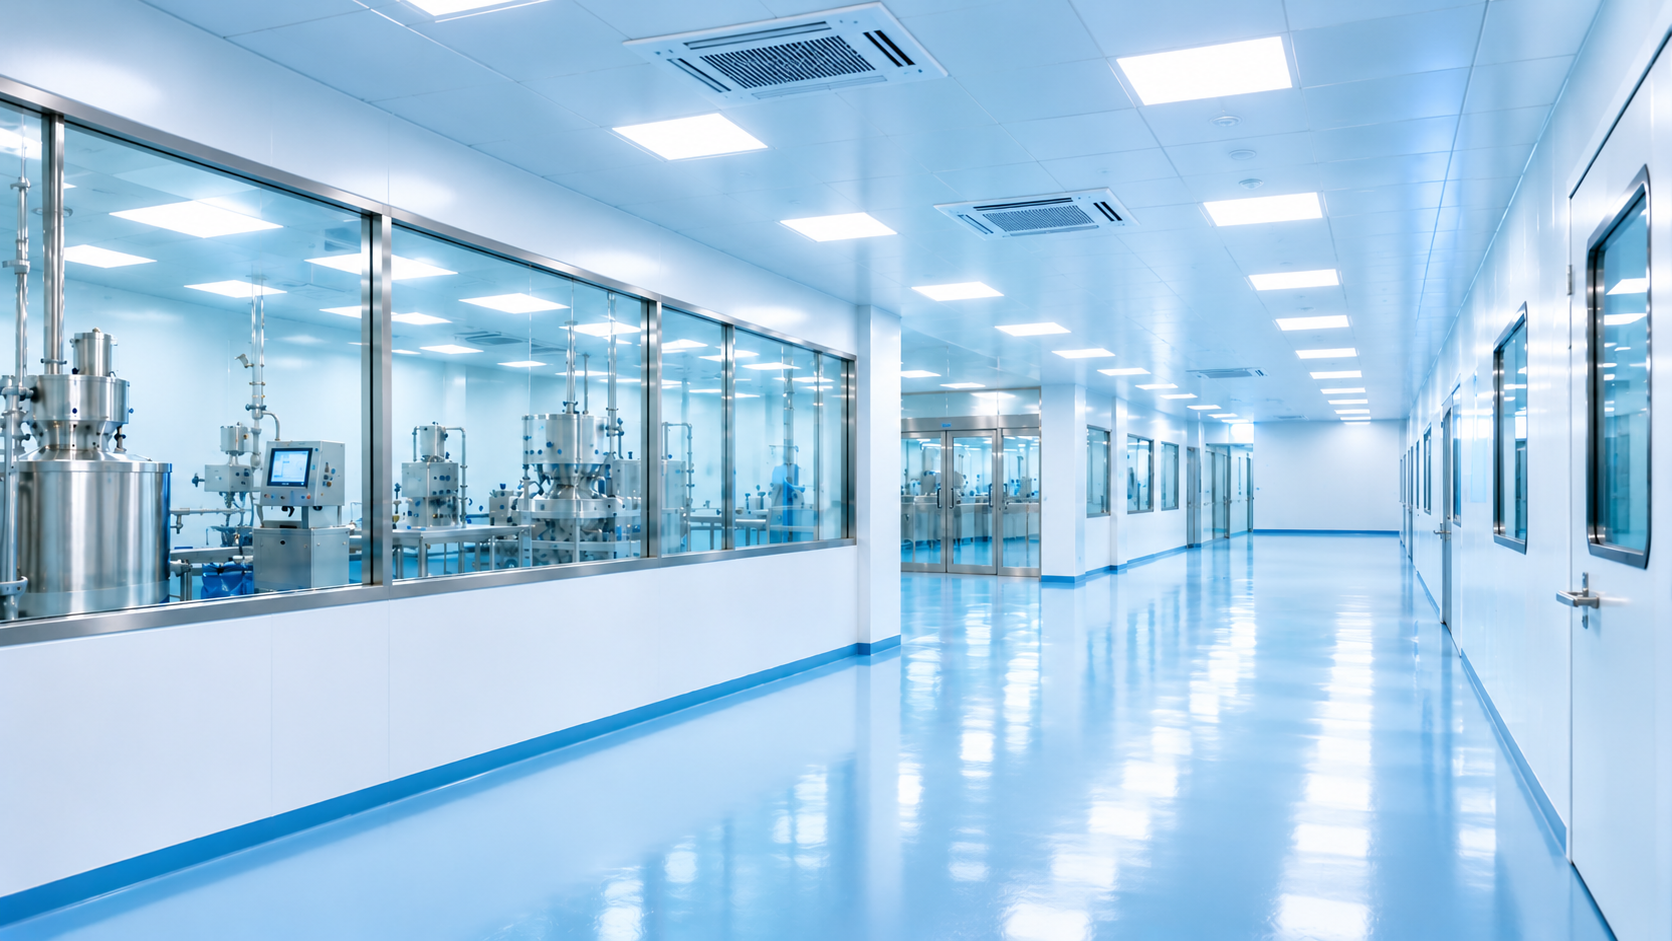
Airflow visualization in a cleanroom helps to understand the flow of air in such spaces for facility managers and engineers. This enables them to observe the pattern of air flow near equipment, people, and important work zones to find out the possible contaminants.
Airflow visualization in cleanrooms is especially beneficial for those facilities which involve manufacturing of pharmaceutical products, medical devices, and similar applications. By studying the behavior of airflow in given conditions, facility management can evaluate whether the arrangement of airflow is suitable for a given manufacturing process.
Nevertheless, visualization by itself is not an indicator of compliance of a cleanroom.
What Is Cleanroom Airflow Visualization?
One of the testing procedures for cleanrooms is airflow visualization, which helps to track the movement and behavior of air in the room. Typically, it includes the introduction of a proper visible tracer, like approved test fog, and documenting its flow in the room.
This way, engineers can see how the air behaves in relation to equipment, surfaces, operators, and important process locations.
Different from particle counting, which is about measuring concentration of airborne particles in the cleanroom, the airflow visualization shows airflow movement. Both techniques provide different information and could be applied together while analyzing cleanroom performance.
Importance of Airflow Visualization
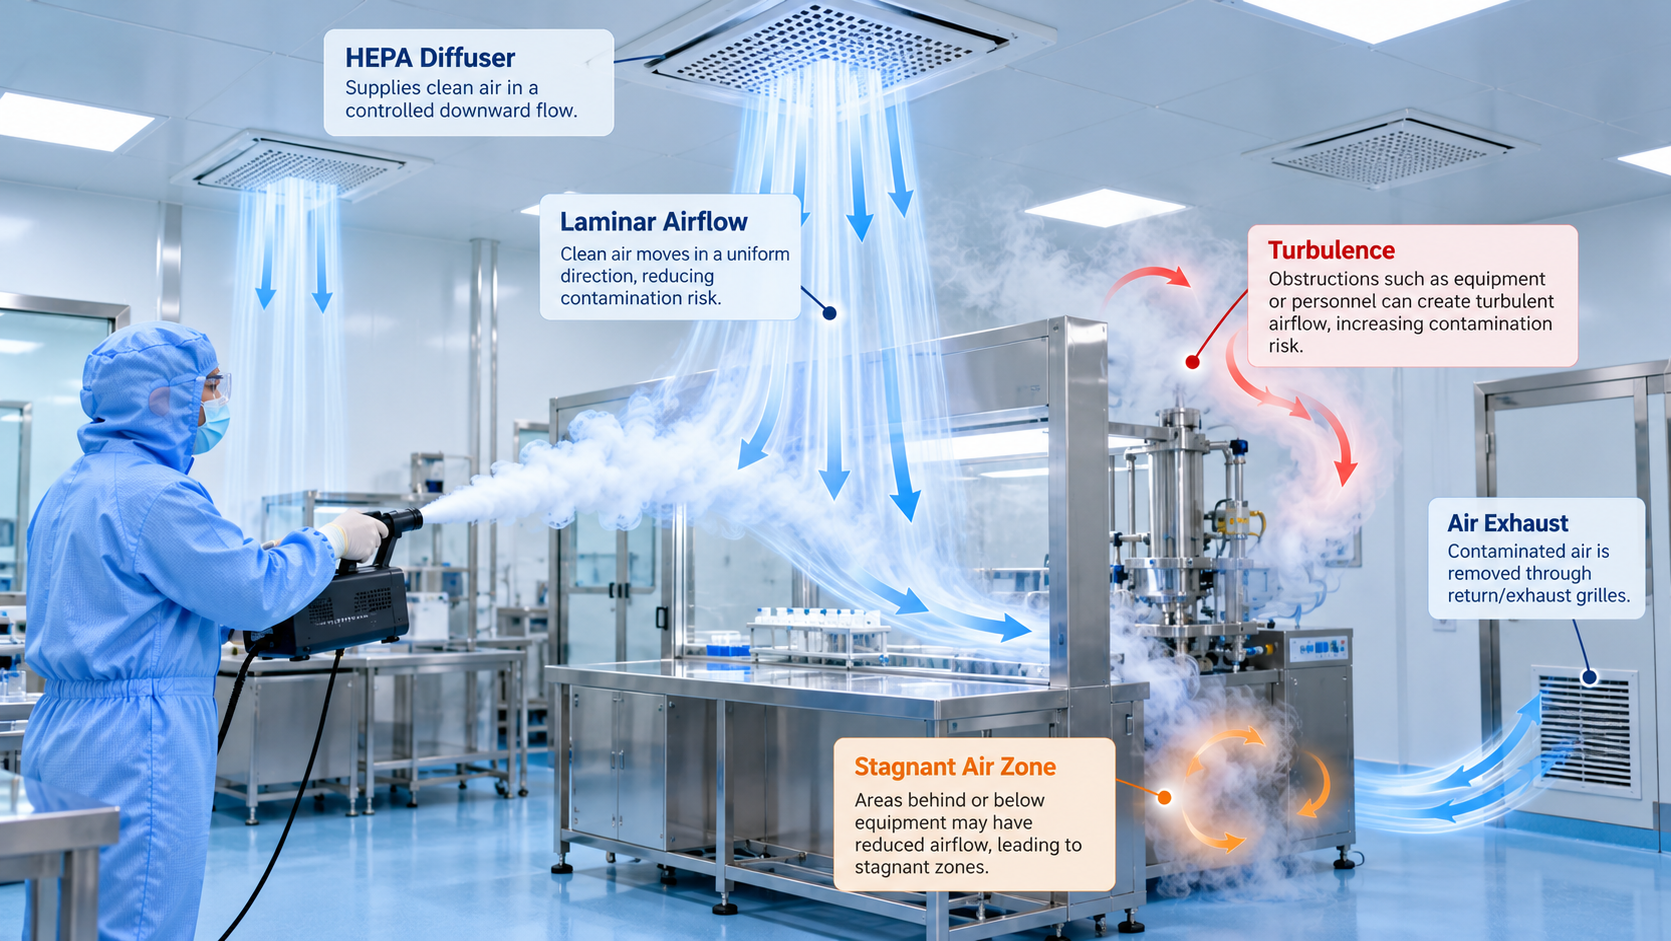
Airflow patterns affect the way particles and contaminants behave in a cleanroom. Incorrect positioning of equipment, inappropriate design of airflows, or too many obstacles can disrupt the expected airflows.
With a good cleanroom airflow visualization analysis, it is possible to:
- Notice an unexpected airflow direction or turbulence.
- Find any stagnant zones near the equipment.
- See airflow near critical manufacturing processes.
- See the effect of operator movement on air flows.
- Investigate any potential contamination routes.
- Analyze the airflow after facility modification.
This analysis allows facility managers to detect any potential issues and decide whether it needs any further investigation.
Methods Used for Cleanroom Airflow Visualization
1. Smoke Studies
Observation of Airflow by Using Smoke Studies is the common way of observing flow characteristics. A suitable and visible tracer is applied in selected places where one can observe its movement.
The study could be carried out in relation to equipment, work station, doors, transfer point, and important production area.
Tracer used should be suitable for that application and should not contaminate or damage equipment. The test should be carried out using an approved procedure especially when the products are exposed to or aseptic operation is being done.
2. Video Recording and Analysis
Video recording serves the purpose of giving the visual presentation of airflow behavior. It enables engineers to analyze the observation and compare different locations.
Video recordings should indicate clearly the test area and operation conditions under which test was carried out. Standardized video recordings make easier comparison of test results.
The video evidence should help in documenting the observation and not replacing technical analysis.
3. Instrument-Assisted Airflow Assessment
The visualization of airflow might be supplemented by proper instrumentation that allows for measuring the velocity of airflow or other parameters related to the test.
Such data might be used in addition to the visual observations and depend on the type of cleanroom under consideration and objectives of the investigation.
How to Perform a Cleanroom Airflow Visualization Test
Step 1: Define Testing Objectives
Define the objectives of the investigation – it might be the study of airflow around exposed products, movement of airflow near the openings of equipment, unexpected airflows near the doors, etc.
The acceptance criteria have to be defined in advance.
Step 2: Preparation of the Cleanroom
Make sure the cleanroom is in the required mode.
Record all necessary data about its current status – HVAC system status, equipment setup, doors position, personnel presence, etc.
Use only approved tracers and make sure that the test won’t affect the product quality or cleanroom’s cleanness.
Step 3: Select Testing Locations
Select sites based on the process and possible contamination risks.
Possible sites include critical working areas, areas behind machinery, material transfer sites, and areas where there may be an obstruction in the air flow.
The test plan should provide reasons for selection of each site.
Step 4: Monitor and Record Air Flow
The tracer gas should be introduced in a standard way and monitored for movement.
Note direction of flow, unusual movement, turbulence, and movement towards critical areas. Photographs, video and sketches can be used to record results.
Step 5: Review Results
Compare results of air flow movement with the intended air flow pattern and acceptance criteria.
Unusual air flow movement should not necessarily be considered a failure.
Step 6: Implement Corrective Actions
Corrective actions may include assessing the position of equipment, examining the HVAC changes that have been approved, fixing the seals, or changing the operating procedures depending on the findings.
The change must be evaluated based on its effect on the controlled environment. Re-test the system following the corrective action to see if the desired result has been achieved.
Common Problems Encountered When Testing the System
Turbulence
Equipment, shelves, and movement of people within the clean room can cause disturbance in airflow patterns. The engineers should assess the effect of the observed turbulence on the critical area.
Poorly Swept Airflow Areas
Airflow patterns can be poorly swept behind large pieces of equipment or obstacles. These areas must be tested to determine if the airflow pattern requires improvement.
Airflow Changes due to Doors
Movement of doors can lead to change in the local airflow and pressure relationship. The test must be done under normal operating conditions.
Consistent Test Results
Unexplained differences in the results obtained during testing can be attributed to the difference in the test procedure.
Documentation and Follow-Up
The testing report should be supplemented with information on the objective, methodology, testing areas, operational conditions, acceptance criteria, findings, relevant recordings, deviations and conclusions.
The report must also reflect information about corrective actions taken and additional testing results.
Airflow visualization in the cleanroom can be considered together with other available information – for example, particle data, air pressure differential information, and qualification information. Such an approach provides more comprehensive information on cleanroom performance.
Conclusion
Airflow visualization in the cleanroom is an important tool that will allow to assess airflow behavior and possible contamination paths. Conducting smoke tests, making video records and performing the necessary instrument assisted analysis will enable engineers to evaluate the airflow around equipment and workstations.
With the right objectives, methodologies, findings, and investigation of any deviations, facility managers can understand better how the cleanroom operates.